This web page was produced as an assignment for Genetics 564, an undergraduate course at the University of Wisconsin-Madison.
Protein - Phylogeny
What is Phylogeny?
Phylogeny is the study of the history of organism lineages as they change through time [1]. Although evolution has resulted in species that differ from one another, they contain many genes and proteins that are similar or identical because of their shared ancestors [2]. Trees can be created to demonstrate these evolutionary relationships between species. The places where the branches meet, the Nodes, represent that all of the species after that point share a common ancestor. If two species share a closer node than either share with a third species, then they share a more recent common ancestor. This shows that those two species are more closely related [3].
There are many different algorithms that are used to determine where the species fit onto the phylogenic trees, and many websites that utilize these algorithms to determine evolutionary patterns between species. I analyzed the similarities between the proteins in the several species that I found as homologs for the CNGA3 protein. I did this using two algorithms on a website called ClustalW2. These two different methods included using percent identity and using BLOSUM62. Both of these methods can yield very different trees and neither is completely 100% correct every time. For each of these methods either a neighbor joining tree or an average distance tree can be created.
Percent Identity:
This method identifies what percent of the two sequences has the same bases at each aligned position [4].
BLOSUM62:
BLOSUM62 utilizes a matrix that helps identify similarities at each aligned position. The sum of the scores that the matrix provides are used to created the phylogeny tree [4].
Neighbor Joining Tree:
Either BLOSUM62 or Percent Identity can be used to created a neighbor joining tree. The creation of this type of tree applies a long algorithm to find the phylogeny tree with the shortest branch lengths [4].
Average Distance Tree:
Either BLOSUM62 or Percent Identity can be used to created an average distance tree. This type of tree forms clusters using the percent identities calculated and places the branches at an average distance from one another [4].
Phylogenetic Trees for the CNGA3 Protein in Various Homologs
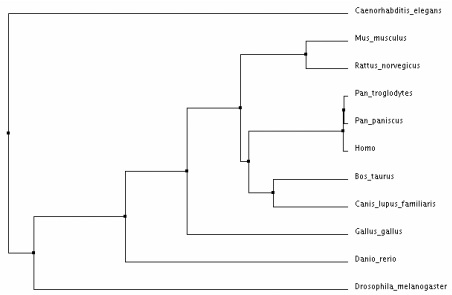
Figure 1: Average Distance tree using %Identity
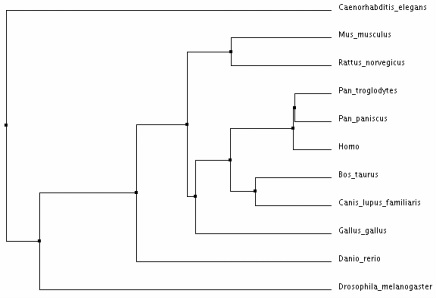
Figure 3: Average Distance Tree Using BLOSUM62
|
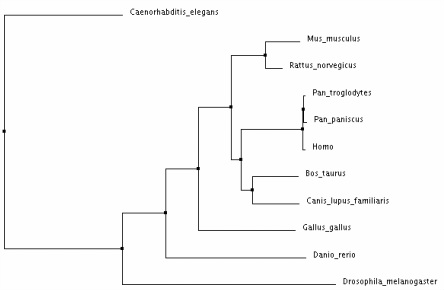
Figure 2: Neighbour Joining Tree Using %Identity
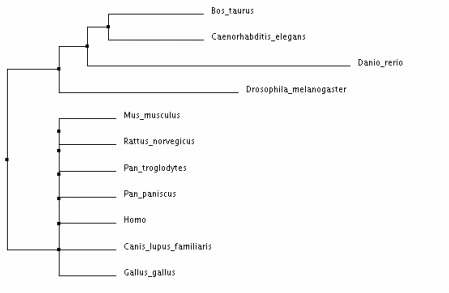
Figure 4: Neighbour Joining Tree Using BLOSUM62
|
Analysis:
The different types of tree analysis on ClustalW2 yielded similar results. The tree that differed the most provided much less evolutionary evidence between the species - the "neighbour joining tree using BLOSUM62". I believe that the average distance trees most clearly show the evolution of CNAG3 in the various species. This demonstrates that the CNGA3 protein in humans is most closely related to Pan Troglodytes and Pan Paniscus, which makes sense because humans are relatively closely related to monkey's in many instances. Drosophila Melangaster and Caenorhabditis Elegans are the most distant from the mammals shown, which makes sense because phenotypically these species are much more different.
Knowing how closely related the CNGA3 protein is between the species evolutionarily, can be used when determining what model organism to study in order to gain more information about the protein. As a result of the CNGA3 protein being better conserved in model organisms than the CNGA3 gene, I focused on the protein homologs rather than the gene homologs when studying phylogeny. When I attempted creating trees for the few homologs that were found for the gene, they showed very little consistency, which provided more evidence that the protein will be more beneficial to study.
